Canada.ca
Protecting Oceans Sitemap
Mapping out large amounts of information so everyone can get where they need to go fast and stay informed.
(Group Project, 5 members)
Project Overview
This site is designed to be the central hub of information regarding Marine Protected Areas (MPAs) in the oceans of Canada. It provides a broad overview of how the Canadian government works to conserve and protect its country's marine environments. This site was designed to raise awareness among the public about the role of MPAs in protecting ecosystems, biodiversity, and marine environments, while also providing information on government policies and regulatory standards. This site targets a wide range of users, as it can be used to help policymakers, support scientists, indigenous groups, and non-governmental organizations access relevant, official information on MPAs. It can also be used for educational purposes or by anyone interested in the various policies and acts implemented to help conserve our oceans.
To identify the challenges this site presented, our group conducted both a card sort and a tree test to evaluate how users navigate and categorize information from our website. This provided helpful insights as to what we could change in terms of the labels and structure of our site to aid users in finding the information they need more easily.
My Roles
Commucations
Researcher/Mapping
Sitemap Redesign
Methods
Tree Testing (A & B)
Card Sorting (Open)
Tools
Figma
Proven by Users
Microsoft Word
Google Docs
Mural
Adobe Illustrator
Duration
September - December 2025 (3 Months)
Card Sorting
Our card sort had a total of nine participants, which included our classmates who shared the same level of knowledge on our topic. This was an open card sort where users had to create their own categories and put items in that they think should be grouped together.
Figure 1 is our similarity matrix, where you can see the percentage of times cards got grouped together. The darker blue the square is, the higher the percentage of time people grouped the two cards together.
This data was useful as we can see that the content that was grouped together the most showed the strongest connections and should be placed in the same category. For example, “Oil Spill Preparedness” and “Scientific support for environmental emergencies” were grouped together 100% of the time, strongly indicating that users view them as part of the same topic area and should be placed in a group together. This diagram also shows what cards are rarely placed together. Suggesting that there may be an information architecture issue where labels are not clear. Addressing these findings will improve the overall clarity and usability of our content structure.
Figure 2 shows the different groups that users came up with, 25 in total. The most common groups were “pollution” and “land”, with five and four users creating those categories, respectively. A finding from the category table shows that although the themes were consistent, the labels used to categorize them were varied. The headings are difficult for users to categorize, emphasizing the need for further research to work on a better solution.
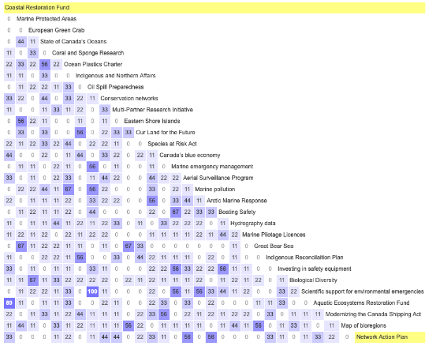
Figure 1: Card Sort Similarity Matrix
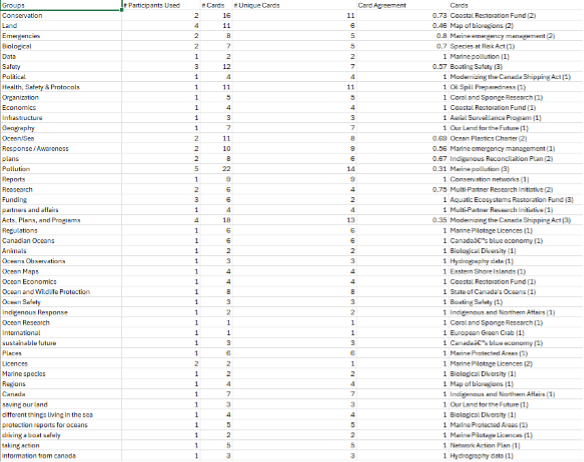
Figure 2: Card Sort Categories Table
Tree Testing
Through our Tree Tests, we are able to analyze user patterns on a simplified version of a site structure to determine if they are able to find important information, and if not, look closely at the data to determine what exactly does not work for users in the site.
For our tasks we required users to go fairly deep into the hierarchy and cannot be found in just one click. We wanted to learn if the labels and structure on our website were clearly communicated so users could navigate around to find what they need without confusion. These tasks are also something that users could be searching for, for either research or educational purposes. This is why we made sure that the tasks we gave users involved navigating through different hierarchies to ensure that most of the site is being navigated.
Original Tree Test
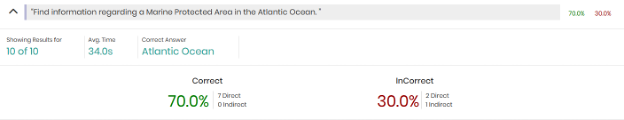
Find information regarding a Marine Protected Area in the Atlantic Ocean.
a. Protecting oceans (Home page)
b. Marine protected areas, areas of interest and other measures
c. Marine Protected Areas across Canada
d. Atlantic Ocean
Task and Path 1
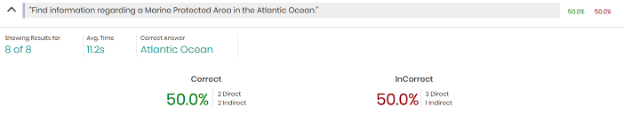
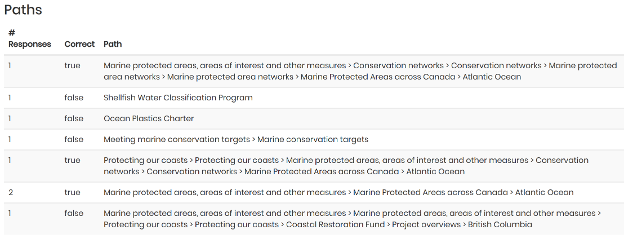
Seen in Figure 3, users were split 50/50 on their ability to locate an MPA in the Atlantic Ocean and only two were able to directly find the MPA. We also can see the various pathways users used in the Tree Test. Two users found it immediately, while others got there after a bit of backtracking through different links, while others went down different paths with labels that they perceived to be related to MPAs like Shellfish Water Classification Program, Oceans Plastic Charter, and Meeting Marine Conservation Targets.
Figure 3: Original Tree Test Results (Task 1)
Find the coastal restoration funds and the projects available in Nova Scotia.
a. Protecting oceans (Home page)
b. Coastal restoration fund
c. Project Overview
d. Nova Scotia
Task and Path 2
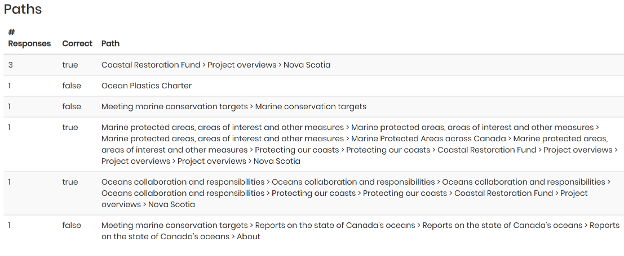
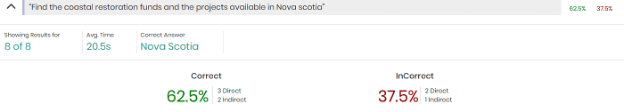
Figure 4: Original Tree Test Results (Task 2)
Seen in Figure 4, There was a total of five participants who got the correct answer, but only three of those participants got the answer directly. Those three participants went to the coastal restoration funds page, then to the project overviews page, and then finally to the Nova Scotia page. The other two participants got the correct answer, but it was indirect.
Revised Tree Test
Find information regarding a Marine Protected Area in the Atlantic Ocean.
a. Protecting oceans (Home page)
b. Marine protected areas and networks
c. Marine Protected Areas by region
d. Atlantic Ocean
Task and Path 1
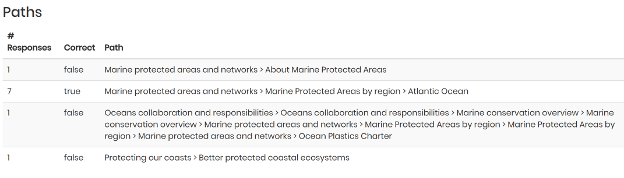
Seen in Figure 5, From the data, we can see a jump in users finding the correct path for the task. Seven out of ten users got it correct, and all directly chose the right path. Our proposed improved site structure was partly validated by this result
Figure 5: Revised Tree Test Results (Task 1)
Find the coastal restoration funds and the projects available in Nova Scotia.
a. Protecting oceans (Home page)
b. Funding and Programs
c. Restoration projects by Provinces and Territories
d. Nova Scotia
Task and Path 2
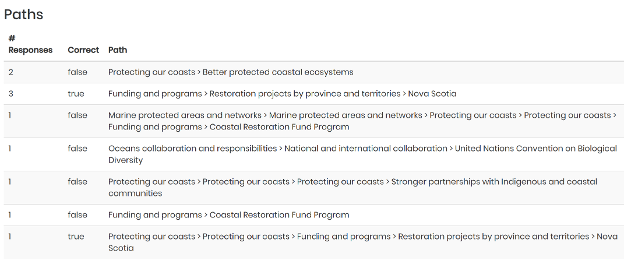
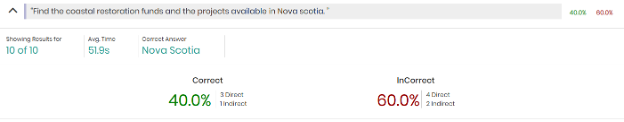
Figure 6: Revised Tree Test Results (Task 2)
Seen in Figure 6, our revamp did not prove more successful than the original layout, which was a learning experience for us that still gave valuable data.
Our Recommendations
Merge Funding, Plans, and Programs
Card sorting revealed users grouped funding, plans, and programs together.
Participants viewed these items as related government initiatives and support.
Combining them into one section reflects user mental models and simplifies navigation.
A unified section makes resources easier to find.
Rename Labels for Better Clarity
Users were confused by similar or unclear page names.
Ambiguous labels often led users to the wrong content.
Rename pages with more descriptive titles (e.g., “About Marine Protected Areas” → “Defining Marine Protected Areas”).
Clearer labels improve navigation and reduce confusion.
Merge MPA Pages
Users viewed MPAs as one category rather than separate sections.
Tree testing showed users struggled to find regional MPA information when it was spread across multiple pages.
A single MPA pathway improved success rates and reduced navigation errors.
Consolidating MPA content into one hub with regional sub-navigation matches user expectations and reduces cognitive load.
Add Page Search
Users had difficulty locating information through navigation alone.
Add a global search bar to provide a direct way to find content.
Include search results and “Did you mean…” suggestions.
Search would improve efficiency and increase task success rates.
Through our research and analysis, we developed a few recommendations to better help users navigate and utilize the site.
We used these reconmendations as a basis when designing the sitemap and wireframes below.
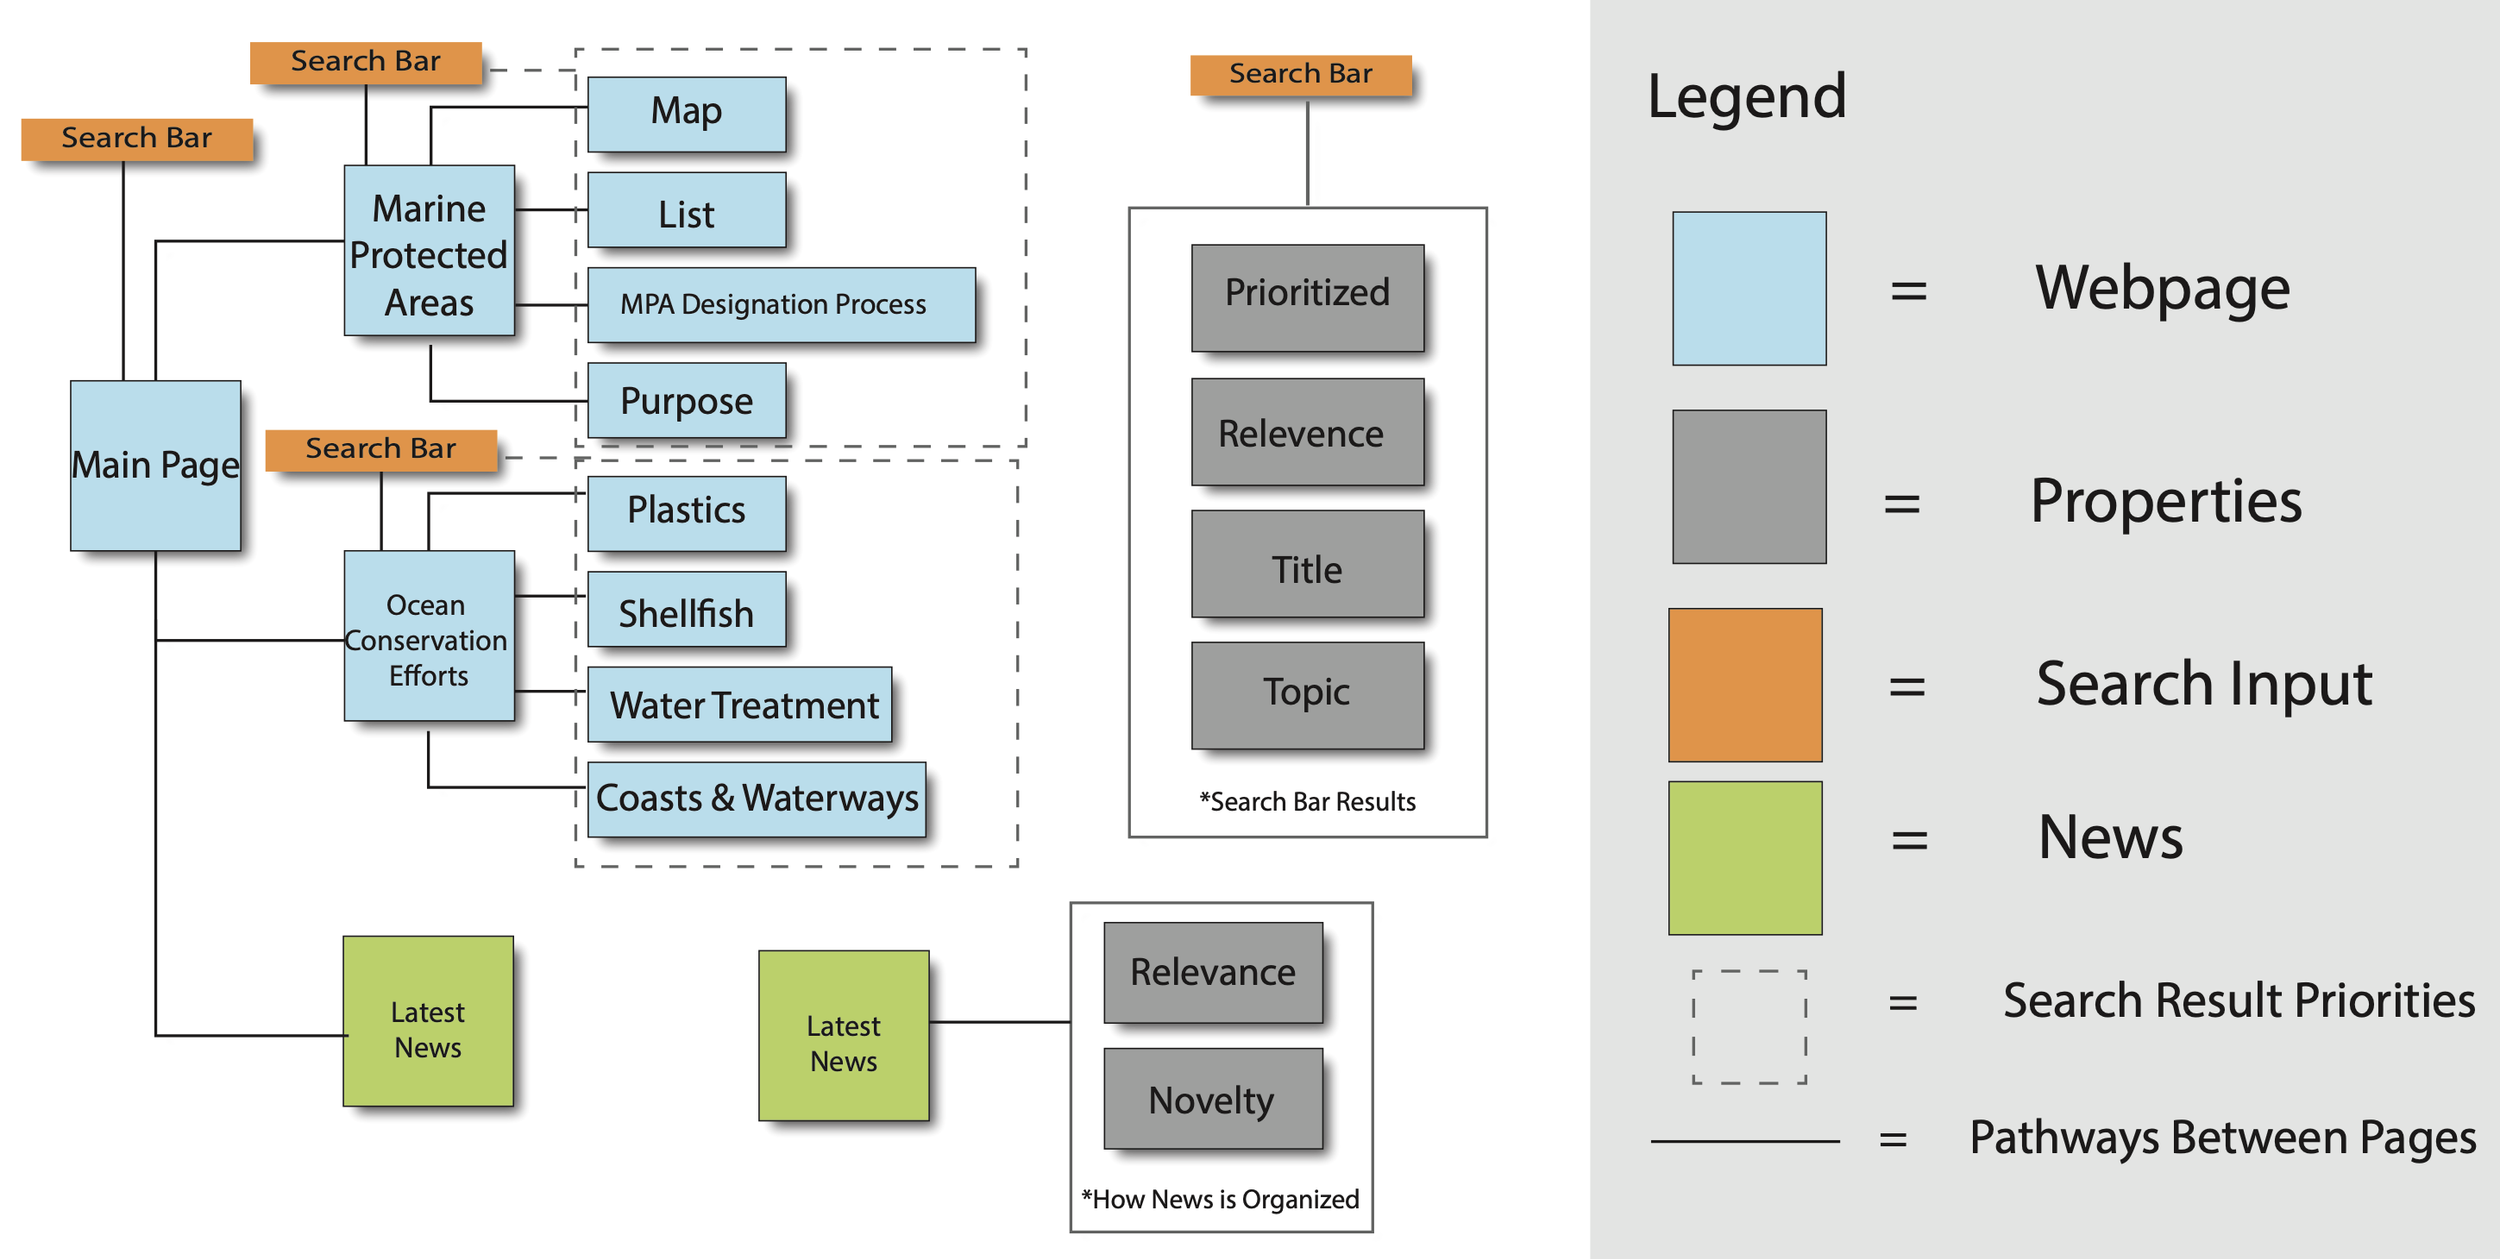
Final Sitemap Redesign
Figure 7: Sitemap Redesign (Up to 3 layers)
Concept Wireframes
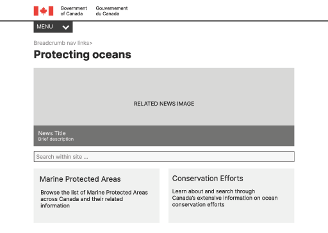
Figure 8: Protecting Oceans Page (Level 1)
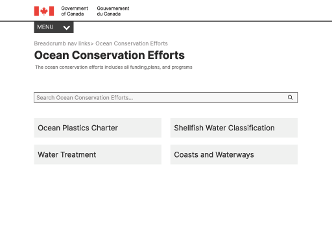
Figure 10: Ocean Conversation Page (Level 2)
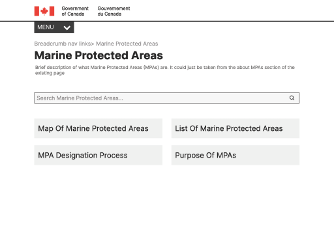
Figure 9: Marine Protected Areas Page (Level 2)
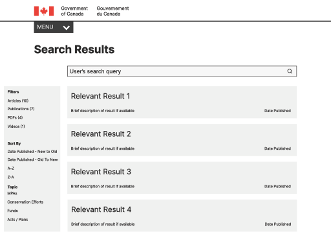
Figure 11: Search Engine Results Page (SERP) (Level 2)